You've heard it from the news, from your family, from your friends: we need to flatten the curve. Paired with this refrain is the now famous line chart showing two possible progressions for COVID-19. One where the outbreak is left unchecked, and another where preventive measures slow the spread and ease the burden on health systems.
This illustration is a basic version of an epidemiological model—a system of mathematical equations used to track the spread of a pathogen and predict how an epidemic might unfold.
Public health professionals and policy makers rely on epidemiological models as they make key decisions. Those decisions include which social distancing measures to put in place, how to best utilize resources within a health system, and what other measures can be taken to reduce COVID-19's impact on their communities. These models create a picture of the situation today, what could happen in the next week or month, and whether preventive measures are working.
Modeling COVID-19
Most models of COVID-19 are based on the ‘SEIR’ model, which tracks the flow of individuals through four stages: susceptible (S), exposed (E), infectious (I) and recovered (R). This type of model keeps track of the number of individuals in each of these four stages at any given time in order to provide insights into the pandemic.
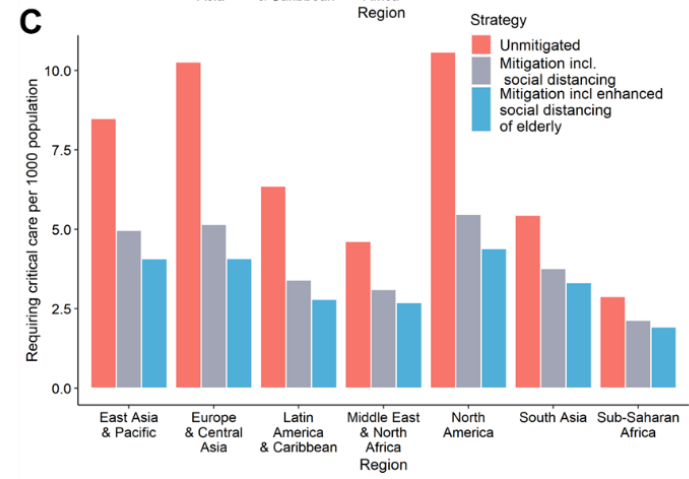
Groups like Imperial College London and the Institute for Disease Modeling have created complex versions of SEIR models that account for age-specific patterns of transmission and disease severity (noting important differences in how a five-year-old and an eighty-year-old might be exposed and what their outcomes might be). Exploring the mechanics of transmission in this way allows us to test different interventions—social distancing, for example—and simulate how they change the lifecycle of the pandemic.

A report from Imperial College London estimated the number of infected individuals that will require critical care. Source: http://www.imperial.ac.uk/mrc-global-infectious-disease-analysis/covid-19/report
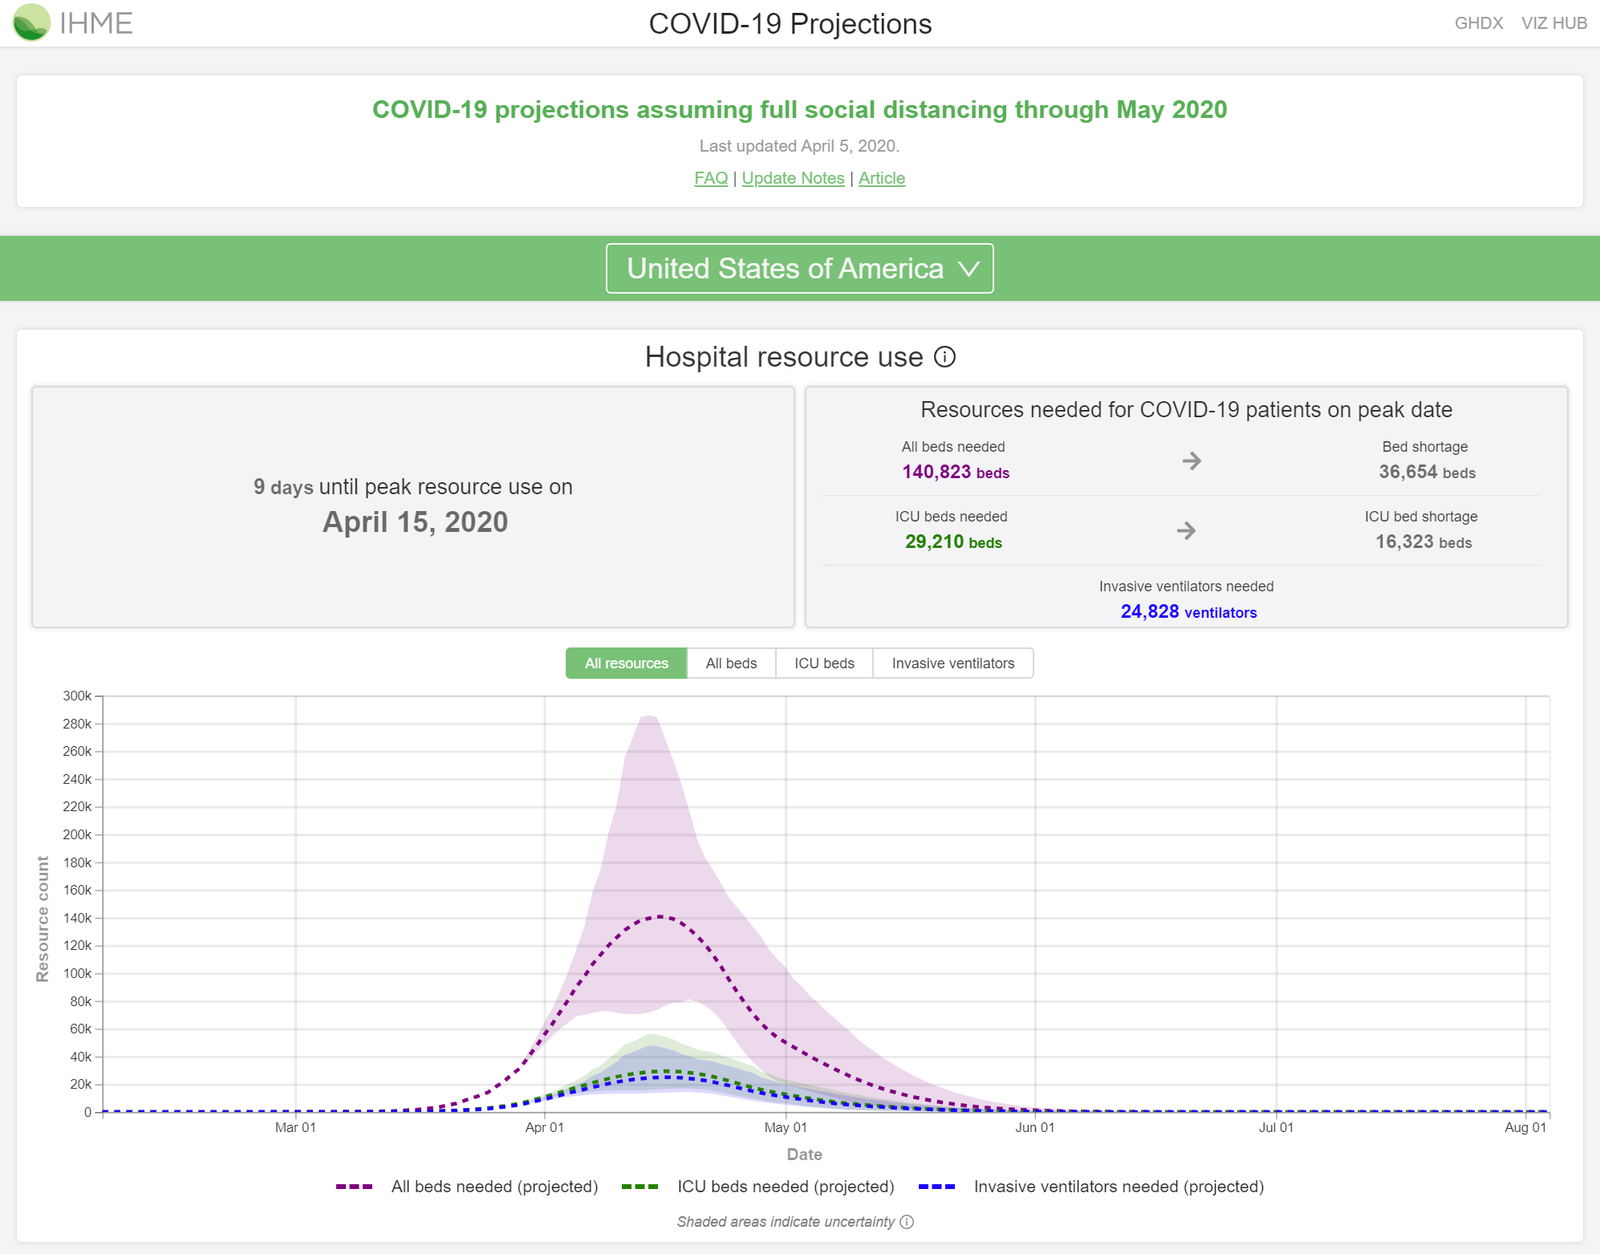
Different models use different assumptions and techniques—which means that they give us different insights. While the majority of models are based on SEIR, the Institute for Health Metrics and Evaluation are using a statistical model which assumes that the daily deaths per population will follow a normal distribution (a bell curve) which they fit to mortality data and social distance data from each state in the United States. This type of model can help estimate the timing and magnitude of the peak to support hospital provision planning.

Projections from the Institute of Health Metrics and Evaluation assess the potential demand for hospital beds and ventilators in the United States. Source: https://covid19.healthdata.org/projections
Information from both modeling approaches is useful for several reasons. Public health decision makers can use these models to identify when demand may increase for hospital beds and ventilators. Epidemiologists can help to guide national policy by predicting social distancing's impact (as well as the impact of other preventive measures) on slowing the rate of transmission.
Models can also help assess how well preventive measures are actually working—critical information for policy makers deciding how and when to relax these measures. Epidemiologists and researchers can also use models to identify gaps in response and gaps in available data.
Finally, these models can help predict how far into a pandemic we are—are we closer to the beginning or closer to the end?
Improving the models
While epidemiological models continue to provide critical insights on COVID-19, there are important limitations to consider.
For example, we don't know how many cases of COVID-19 have been very mild or even asymptomatic. We also don’t know how long these hidden cases last or how infectious they are. Although SEIR-based models try to account for this by assuming a proportion of infected individuals will have either no or sub-clinical symptoms, large scale studies in the wider population are needed.
Current diagnostic tests can only tell if a person is presently infected with the virus. But work has begun to develop serologic testing—tests that can detect the antibodies created when a person fights off infection. A serologic test will help us discover how many people have already been infected. With this information, we'll have a much clearer picture of how far away the pandemic's end might be.
Another challenge? Testing rates and data quality vary widely between and within countries. Accounting for these differences in models is complicated and affects the quality of predictions, especially at the beginning of an epidemic. As testing becomes more widespread and data standards become more widely adopted, both the models and the data will improve.
Modeling for equity
COVID models today are based on the pandemic’s epicenters: the United States, Europe, and China. However, cases continue to increase beyond those locations, including in Southeast Asia, Africa and Latin America. Some work is already underway to adapt existing models to help predict the pandemic’s course in these regions—taking into account different demographic and population factors that could alter the model’s applicability. For instance, the ways and extent to which people interact in different areas may affect disease transmission, and models will need to be adjusted accordingly.
Finally, predictive models are only as accurate as the data that informs them. In places where data systems may be weaker or where there is simply less information (because of less frequent or less equitable approaches to testing), the epidemiological forecast will be less reliable and could give responders a false sense of the virus’ penetration in a community. If the disease burden is understated in a region, fewer resources may be made available. Responders must understand the limitations of models in these locations to ensure the needs of the community are met and the outbreak is contained.


